Kalimantan, Indonesia. October 2019. Underground peat fires have been burning for weeks across an area the size of Belgium, most of them invisible at ground level. The smoke rises but the fire front does not. Aerial surveillance finds only haze. A ground crew moving into the forest walks over active combustion without knowing it, because peat burns laterally through the soil, not upward through the canopy.
The satellite does not have this problem.
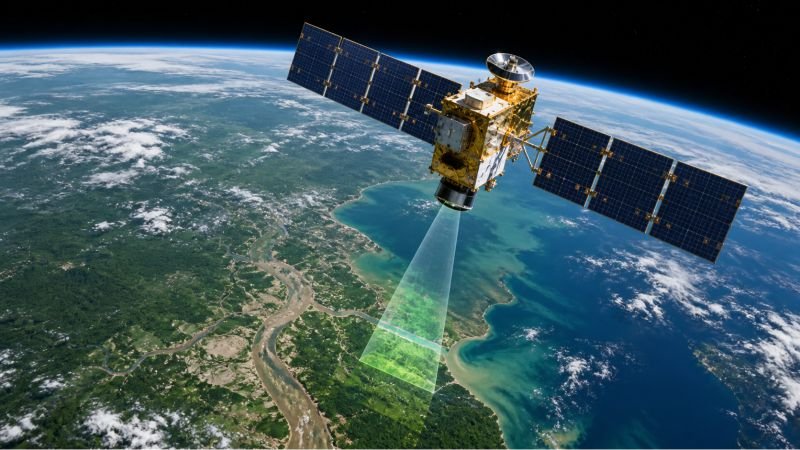
NASA’s Terra spacecraft, carrying the MODIS sensor package, passes over the island at 705 km altitude twice daily. In the thermal infrared band, it detects heat anomalies through smoke. In the shortwave infrared band, it distinguishes the spectral signature of smoldering peat from the signature of surface ash. From a single overpass, analysts in Jakarta produce a map showing where underground fire fronts are actively spreading, at 500-meter resolution, in near real-time. No one on the ground knew those fire perimeters existed until the satellite said so.
The short version: Environmental monitoring with remote sensing works by detecting electromagnetic radiation reflected, emitted, or backscattered from Earth’s surface. Different materials have distinct spectral signatures across visible, infrared, and microwave wavelengths, and sensors on satellites and drones read those signatures to map vegetation health, surface temperature, and deforestation. Landsat 8 resolves features as small as 15 meters from an orbital altitude of 705 km. The Sentinel-2 constellation revisits any point on Earth every five days. What makes remote sensing useful for environmental monitoring is not any single satellite but the combination of wavelengths, revisit frequencies, and sensor types working in parallel.
Table of Contents
How Remote Sensing Reads the Electromagnetic Fingerprint of Earth’s Surface
Every material on Earth’s surface interacts differently with electromagnetic radiation. Chlorophyll-rich vegetation absorbs red light strongly and reflects near-infrared strongly, because photosynthesis consumes the red wavelengths while the cellular structure of leaves scatters near-infrared. Bare soil reflects comparably across both bands. Water absorbs almost all incoming near-infrared it receives. These differences are not subtle. They are large enough to be detected from orbit, and consistent enough to be used as identifiers.
Environmental remote sensing is built entirely on this physical reality. A sensor that can distinguish which wavelengths are being reflected or emitted from a surface can, in principle, identify what that surface is made of. Detecting when that composition changes is where the monitoring capability comes from.
The electromagnetic spectrum regions used in environmental remote sensing span from visible light at 0.4 to 0.7 micrometers, through near-infrared at 0.7 to 1.4 micrometers, shortwave infrared at 1.4 to 3 micrometers, and thermal infrared at 8 to 14 micrometers, out to microwave wavelengths used by radar systems. Each region carries different information. Visible light shows what the human eye would see if transported to orbital altitude. Near-infrared reveals photosynthetic activity, moisture content, and vegetation structure. Thermal infrared maps surface temperature. Microwave wavelengths penetrate cloud cover and interact with surface roughness and the dielectric properties of wet versus dry materials.
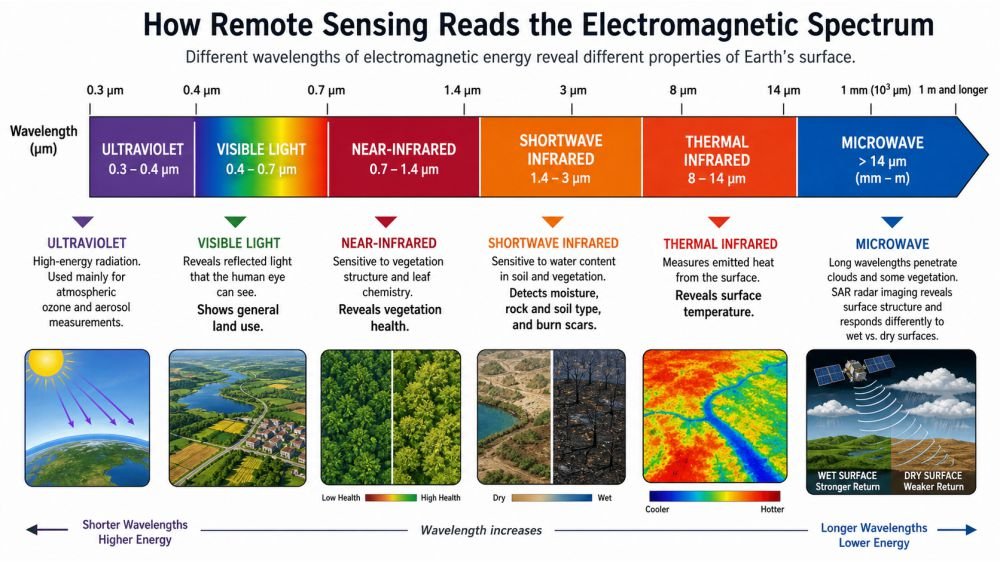
A surface that looks normal in visible light may show severe stress in near-infrared. A fire invisible in optical bands appears clearly in thermal. Monitoring value emerges not from any single observation but from comparing information across wavelengths simultaneously, which is why multispectral sensors carry multiple bands rather than one.
Passive Remote Sensing and the Spectral Bands That Map Forest Health
Most environmental satellites carry passive sensors. Passive means the sensor detects radiation that already exists, whether sunlight reflected from the surface or thermal energy emitted by the surface itself. The sensor contributes nothing to the illumination. It simply measures what arrives.
Multispectral sensors record data in a small number of discrete spectral bands, typically four to twelve. Hyperspectral sensors record hundreds of contiguous narrow bands, producing a full spectral curve for each pixel. A hyperspectral image of a forest can distinguish tree species by their individual spectral fingerprints. A multispectral image identifies whether forest is present, stressed, or absent. Choosing between them involves a tradeoff: hyperspectral sensors produce vastly more data and require more complex processing, while multispectral sensors are operationally simpler but less diagnostically precise.
NDVI and the Mathematics of Measuring Vegetation Health from Orbit
The most widely used calculation in vegetation remote sensing is the Normalized Difference Vegetation Index (NDVI), derived directly from the contrast between near-infrared reflectance and red reflectance. The formula normalizes the contrast to remove the influence of illumination differences across scenes:
NDVI = (NIR – Red) / (NIR + Red)
NIR is the fraction of near-infrared radiation reflected by the surface. Red is the fraction of red light reflected. The result runs from -1 to +1.
With real numbers: healthy tropical forest typically reflects about 50% of incoming near-infrared (NIR = 0.50) and about 7% of red light (Red = 0.07), because chlorophyll absorbs red strongly while cellular structure scatters near-infrared. Running the formula:
NDVI = (0.50 – 0.07) / (0.50 + 0.07) = 0.43 / 0.57 = 0.75
Now the same canopy one month after a burn scar has formed. Near-infrared reflectance drops to 0.25 as leaf structure collapses. Red reflectance rises to 0.20 as chlorophyll disappears. Running the same formula:
NDVI = (0.25 – 0.20) / (0.25 + 0.20) = 0.05 / 0.45 = 0.11
Two numbers from the same pixel on different dates, and the forest’s condition has been characterized without anyone walking under the canopy. Values above 0.6 indicate dense healthy vegetation. Values between 0.2 and 0.4 indicate sparse or stressed cover. Below 0.1 is essentially bare ground. Water bodies produce negative values because they absorb near-infrared almost completely.
NDVI is not the only vegetation index in use, but it illustrates how passive remote sensing extracts diagnostic information from wavelength ratios rather than from absolute brightness. The calculation is straightforward. The physics behind why it works, and why it reliably transfers from one sensor to another across decades of satellite data, required considerable effort to establish.
Active Remote Sensing: How SAR and Lidar Generate Their Own Signal
Passive sensors stop working at night and struggle through cloud cover. In the tropics, where most of the planet’s forests exist, persistent cloud cover is not exceptional weather. It is the baseline condition for months at a time. Waiting for clear sky means accepting data gaps that can stretch long enough to miss an entire deforestation event.
Active remote sensing systems solve this by generating their own signal. Synthetic Aperture Radar emits microwave pulses toward the surface and records the backscattered return. Microwave wavelengths, typically 3 to 25 centimeters, pass through cloud, rain, and smoke without meaningful attenuation. The sensor works equally well at 2 a.m. during a monsoon as at noon on a clear day. Environmental remote sensing in chronically cloud-covered regions often depends on SAR for the primary deforestation record precisely because optical sensors cannot be relied on.
The physical mechanism differs from optical sensing entirely. Microwaves interact with surface roughness and with the dielectric properties of materials, where water content is the dominant variable. A tree canopy scatters radar differently from bare soil, and wet soil scatters differently from dry soil. SAR systems can also detect very small surface displacements by comparing the phase of returning signals between two passes over the same area, a technique called InSAR (Interferometric Synthetic Aperture Radar). Ground settling above a landfill, the slow deformation of a wetland during drought, and millimeter-scale permafrost movement are all within detection range.
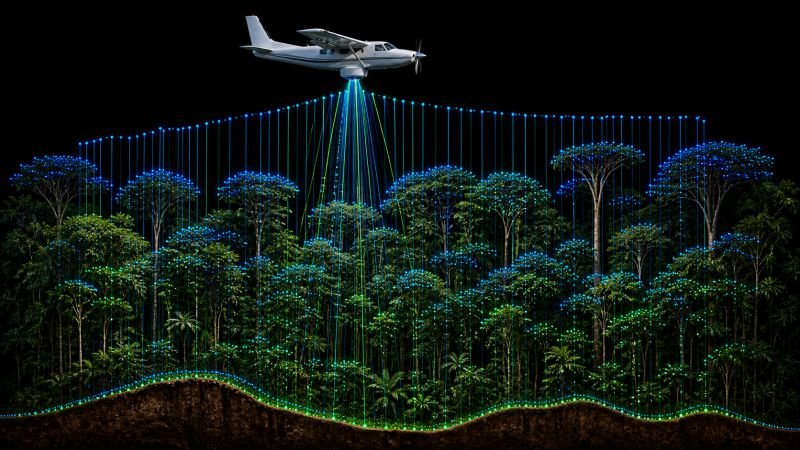
Lidar systems emit laser pulses and measure the time of return to derive precise distance. Airborne lidar surveys produce three-dimensional point clouds of forest canopy structure with vertical resolution under a meter. Canopy height, density, and the layered internal architecture of different forest strata are all measurable. Converting those measurements into aboveground biomass estimates, and therefore into carbon stock figures, is the calculation that makes lidar useful for climate monitoring in a way that pure optical sensors cannot match.
Everything here is free. Readers are the reason it stays that way.
I make all of it alone, with no ads. If it is worth a coffee a month to you, that keeps the next one coming.
Keep it alive →Spatial Resolution, Temporal Coverage, and the Tradeoffs in Remote Sensing Design
A sensor with very high spatial resolution covers a narrow swath, which means fewer orbits cover the same area per week, reducing how frequently any given point gets imaged. A sensor with wide swath coverage accumulates more pixels per day but cannot resolve fine detail into each one. Adding spectral bands increases data volume and requires more complex calibration. No single sensor achieves the highest performance on all three axes simultaneously, because they are physically competing demands built into the geometry of optics and orbital mechanics.
| Sensor | Spatial Resolution | Revisit Period | Spectral Bands | Primary Use |
|---|---|---|---|---|
| Landsat 8 | 15 to 30 m | 16 days | 11 | Land cover change |
| Sentinel-2 | 10 to 60 m | 5 days | 13 | Vegetation monitoring |
| MODIS (Terra/Aqua) | 250 to 1000 m | 1 to 2 days | 36 | Fire detection, ocean color |
| WorldView-3 | 0.3 m | 1 to 4.5 days | 29 | High-resolution commercial imaging |
| Sentinel-1 SAR | 5 to 20 m | 6 to 12 days | Microwave | Cloud-penetrating land mapping |
The practical consequence for environmental monitoring with remote sensing is that no single satellite is sufficient for most real-world tasks. A fire detected by MODIS at 1-km resolution requires Sentinel-2 to map the burn scar perimeter at 20-m resolution. Landsat’s 16-day revisit is too slow to track a flood moving across a river delta. Combining data from multiple sensors acquired at different resolutions and different dates is not a workaround for individual instrument limitations. It is how operational environmental monitoring is actually structured.
Atmospheric Interference and How Remote Sensing Corrects for 100 km of Air
A satellite sensor at 705 km altitude is not looking through a clean window. Between the sensor and the surface sits roughly 100 km of atmosphere containing water vapor, aerosols, dust, ozone, and variable cloud formation. Each component absorbs and scatters electromagnetic radiation in ways that change with season, location, and current weather conditions.
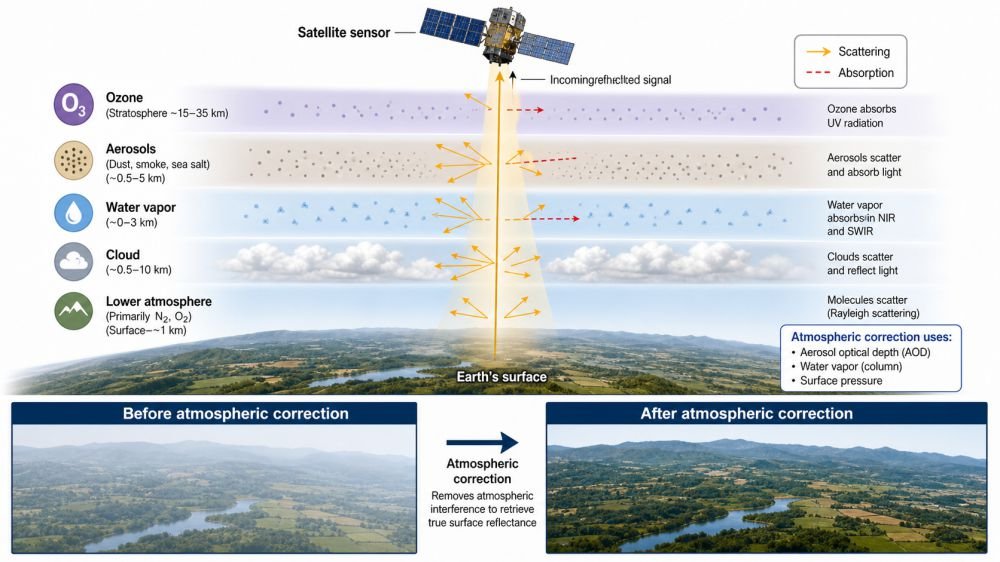
Rayleigh scattering affects short visible wavelengths most strongly. When sunlight passes through air, blue light scatters far more than red, which is why the sky appears blue and why distant mountains take on a blue haze when viewed from a distance. For a satellite sensor looking downward through that same column of air, blue band measurements carry the most atmospheric contamination. Near-infrared and shortwave infrared are less affected by scattering, which partly explains why vegetation remote sensing relies on those bands for quantitative analysis.
Correcting for atmospheric effects requires modeling what the atmosphere was doing at the time of image acquisition. Aerosol optical depth, water vapor column content, and surface pressure are all inputs. Ground-based networks of sun photometers, like the AERONET system operated by NASA at over 600 stations worldwide, provide direct atmospheric measurements that satellite algorithms use for validation and calibration.
Without atmospheric correction, reflectance values from different acquisition dates cannot be compared reliably, and change detection breaks down. Environmental remote sensing derives value from long time series. A single NDVI anomaly in one image means little by itself. The same anomaly appearing consistently across thirty scenes over a decade is a different situation entirely. Consistent atmospheric correction is the infrastructure that makes those long-term comparisons meaningful, which is why it receives more engineering attention than the sensor optics themselves in many operational monitoring systems.
Where Environmental Remote Sensing Reaches Its Physical Limits
Remote sensing is a surface and near-surface observation method. Electromagnetic radiation at the wavelengths used by current sensors does not penetrate soil deeper than a few centimeters, or water deeper than tens of meters even under the clearest conditions. Underground root systems, deep aquifer levels, soil carbon stored at depth, and subsurface geology are not directly accessible by any currently operational satellite.
Spatial resolution is bounded by physics. The diffraction limit of an optical system relates aperture diameter to the minimum resolvable feature at a given wavelength. Imaging at 500-nanometer wavelength from 700 km altitude requires an aperture of roughly 1.4 meters to achieve 0.5-meter resolution. Aperture size drives cost, mass, and launch requirements. Sub-meter commercial satellites like WorldView-3 carry apertures of about 1.1 meters and weigh over 2,500 kg at launch. Pushing resolution further at the same wavelength means physically larger optics, which pushes cost and mass upward in proportion.
Dense cloud cover blocks passive optical sensors entirely. In persistently cloudy regions, this is not a minor inconvenience. The Congo Basin sits under cloud cover over 60% of its area on any given day. SAR fills part of that gap but cannot distinguish spectral properties the way optical sensors can, and interpreting SAR imagery for detailed land cover classification requires different processing pipelines and different ground validation data.
What environmental remote sensing cannot do is observe internal plant physiology, soil composition below the surface layer, or the movement of animals through forest understory. Monitoring those things from orbit requires inference from surface signals, which introduces uncertainty at every step. The method is powerful and globally scalable. It is also indirect in a way that matters when high-precision figures are required, and the environmental monitoring systems that depend on it carry that inherited uncertainty in their outputs.
The Concept Devices Remote Sensing Makes Possible
Environmental monitoring with remote sensing is the observational foundation for a category of future technologies that require continuous, high-resolution knowledge of Earth’s surface state to function at all.
Autonomous carbon monitoring would require knowing forest cover, biomass, and land use change continuously at global scale. Current satellite systems provide irregular snapshots with coverage gaps. A constellation of SAR and hyperspectral sensors with sub-daily revisit times would close those gaps and make real-time carbon accounting possible on the scale that climate agreements need. The physics does not prohibit this. The cost and coordination of deploying that constellation is what currently remains unsolved.
Precision ecological monitoring at the individual tree or plot level would require sensors achieving spatial resolutions near 1 meter across broad geographic areas continuously, not just on commercial contract. Drone-based systems achieve this locally and sporadically. Scaling to continuous landscape coverage, and integrating drone data streams with satellite data into coherent monitoring products, is where the engineering remains unfinished.
Subsurface environmental sensing, using low-frequency radar and microwave techniques that penetrate deeper into soil, could extend remote sensing below the surface layer where most carbon and water dynamics actually occur. Ground-penetrating radar operates at much lower frequencies than imaging radar and does penetrate soil, but adapting it to airborne and satellite platforms at useful spatial resolution and global coverage is an unsolved engineering problem.
What remote sensing established, as a body of science, is that electromagnetic information from Earth’s surface is rich enough to support global environmental monitoring at scales that no ground-based network could reach. The devices that depend on it inherit that foundation. The question is only whether the engineering fills in the gaps that physics does not forbid.
The View From NoSuchDevice
I find it genuinely difficult to identify another scientific method that punches as far above its engineering weight as remote sensing does. The entire system works because physics turned out to be obliging in an unexpected way: surfaces advertise their composition in the electromagnetic radiation they reflect and emit, and that advertisement can be read from orbit. Nobody designed this. It turned out to be a property of how matter interacts with light.
The limitation that matters is the one about indirect inference. Every number produced by remote sensing, whether it is a carbon stock estimate, a deforestation area figure, or a species distribution map, has traveled through at least one layer of assumption between the original photon and the final output. That is not a detail to set aside. It is a structural property of the method that shapes how much confidence any specific output deserves. I think this gets underplayed in how remote sensing data gets used in policy discussions, where numbers from satellite analyses sometimes arrive with more precision implied than the atmospheric corrections and spectral unmixing algorithms actually support.
The concept devices this principle makes possible are worth taking seriously because the observational infrastructure already mostly works. The physics proved itself over Kalimantan in 2019. The question is whether the next generation of sensors, constellations, and processing systems will fill in the gaps that the current generation leaves open.
You read the whole thing.
That is rarer than it should be, and it is the exact kind of attention I built this archive for. I make every piece alone, with no ads and no investor deciding what gets written. If you want the next machine taken apart like this one, you can help me make it.
A coffee a month is enough to keep it free for everyone.
Prefer crypto or a one time gift? Other ways to give →
Technologies Related to This Concept
| Technology | Concept |
|---|---|
| Solar-Powered Air Quality Drones | Concept: Autonomous drones that monitor air quality using solar energy. |
| Graphene Supercapacitors for Environmental Monitoring | Concept: Powering remote sensors with efficient energy storage. |
| Hydrogen-Powered Personal Air Quality Drones | Concept: Drones that monitor environmental conditions. |
| Hydrogen Fuel Cells in Portable Air Quality Sensors | Concept: Portable sensors that track air quality with independent clean power. |
| Graphene Supercapacitors for Wildlife Tracking Devices | Concept: Powering field tracking devices for ecological observation. |